インテルのみ表示可能 — GUID: urg1680167511493
Ixiasoft
1. はじめるまえに
2. はじめに
3. 機能の説明
4. インターフェイスの概要
5. パラメーター (H タイル)
6. パラメーター (P-Tile) (F-Tile) (R-Tile)
7. IP コアを使用したデザイン
8. ソフトウェアのプログラミング・モデル
9. レジスター
10. トラブルシューティング/デバッグ
11. Fタイル Avalon ストリーミング・インテル FPGA IP for PCI Expressユーザーガイドのアーカイブ
12. F タイル Avalon ストリーミング Intel FPGA IP for PCI Express ユーザーガイドの改訂履歴
4.1. ポートリスト
4.2. クロック
4.3. リセット
4.4. マルチ・チャネルDMA
4.5. バーストAvalon Master (BAM) BAR
4.6. バーストAvalon-MM Slave (BAS) インターフェイース
4.7. MSIインターフェイース
4.8. Config Slaveのインターフェイス (RP のみ)
4.9. ハードIP 再構成インターフェイス
4.10. Config TLのインターフェイス
4.11. コンフィグレーションインターセプトインターフェイス(EPのみ)
4.12. データ・ムーバー・インターフェイス
4.13. ハードIPステータス・インターフェイス
8.1.6.1. ifc_api_start
8.1.6.2. ifc_mcdma_port_by_name
8.1.6.3. ifc_qdma_device_get
8.1.6.4. ifc_num_channels_get
8.1.6.5. ifc_qdma_channel_get
8.1.6.6. ifc_qdma_acquire_channels
8.1.6.7. ifc_qdma_release_all_channels
8.1.6.8. ifc_qdma_device_put
8.1.6.9. ifc_qdma_channel_put
8.1.6.10. ifc_qdma_completion_poll
8.1.6.11. ifc_qdma_request_start
8.1.6.12. ifc_qdma_request_prepare
8.1.6.13. ifc_qdma_descq_queue_batch_load
8.1.6.14. ifc_qdma_request_submit
8.1.6.15. ifc_qdma_pio_read32
8.1.6.16. ifc_qdma_pio_write32
8.1.6.17. ifc_qdma_pio_read64
8.1.6.18. ifc_qdma_pio_write64
8.1.6.19. ifc_qdma_pio_read128
8.1.6.20. ifc_qdma_pio_write128
8.1.6.21. ifc_qdma_pio_read256
8.1.6.22. ifc_qdma_pio_write256
8.1.6.23. ifc_request_malloc
8.1.6.24. ifc_request_free
8.1.6.25. ifc_app_stop
8.1.6.26. ifc_qdma_poll_init
8.1.6.27. ifc_qdma_poll_add
8.1.6.28. ifc_qdma_poll_wait
8.1.6.29. ifc_mcdma_port_by_name
インテルのみ表示可能 — GUID: urg1680167511493
Ixiasoft
10.1.4.4.1. Running Eye Viewer in the P-Tile Debug Toolkit
Steps to run Eye Viewer in the P-Tile Debug Toolkit
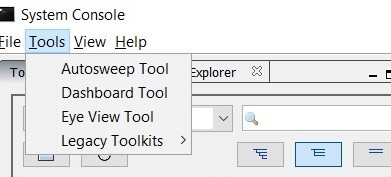
- In the System Console Tools menu option, click on Eye View Tool.
注: The per-lane information under the Eye Viewer tab corresponds to the physical lanes.図 68. Opening the Eye Viewer
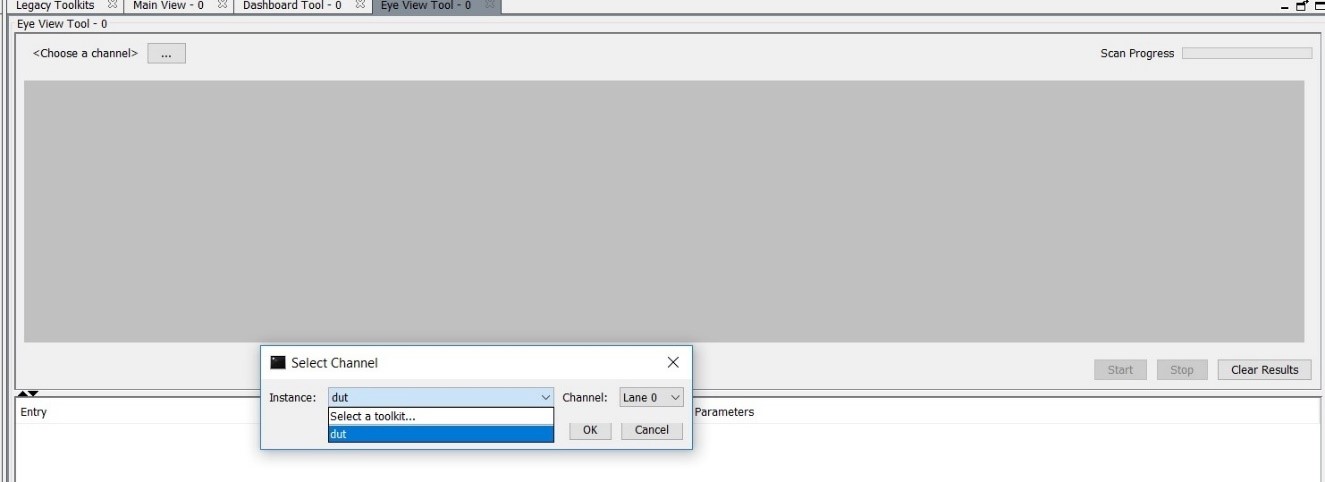
- これにより、Main Viewタブの横に新しいタブのEye View Toolが開きます。アイビューテストを実行するインスタンスとチャネルを選択します。
図 69. インスタンスとチャネルを開く
- For P-Tile debug toolkit, set the Eye Max BER. Two options are available: 1e-9 or 1e-12.
- Click Start to begin the eye measurement for the selected channel.
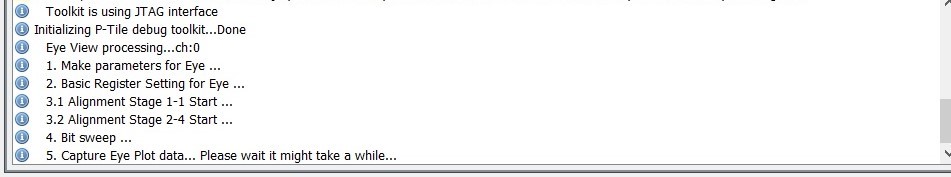
- The messages window displays information messages to indicate the eye view tool's progress.
図 70. Eye View Tool Messages
- Once the eye measurement is complete, the eye height, eye width and eye diagram are displayed.
図 71. Sample Eye Plot [for BER = 1e-9 in P-Tile debug toolkit]
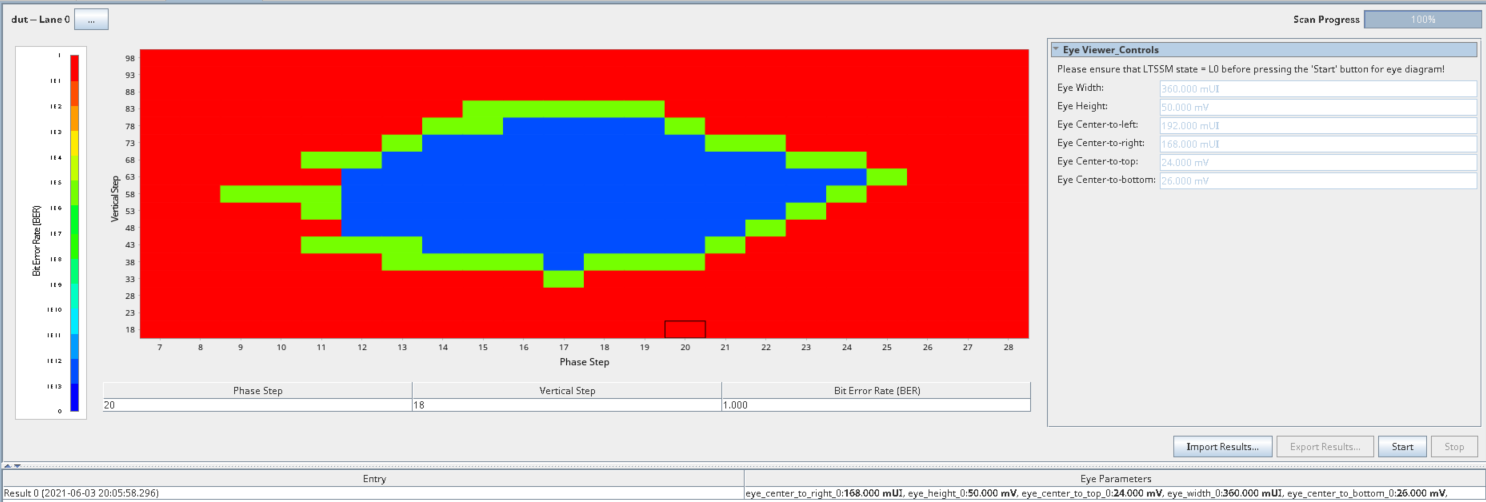 図 72. Sample Eye Plot [for BER = 1e-12 in P-Tile debug toolkit]
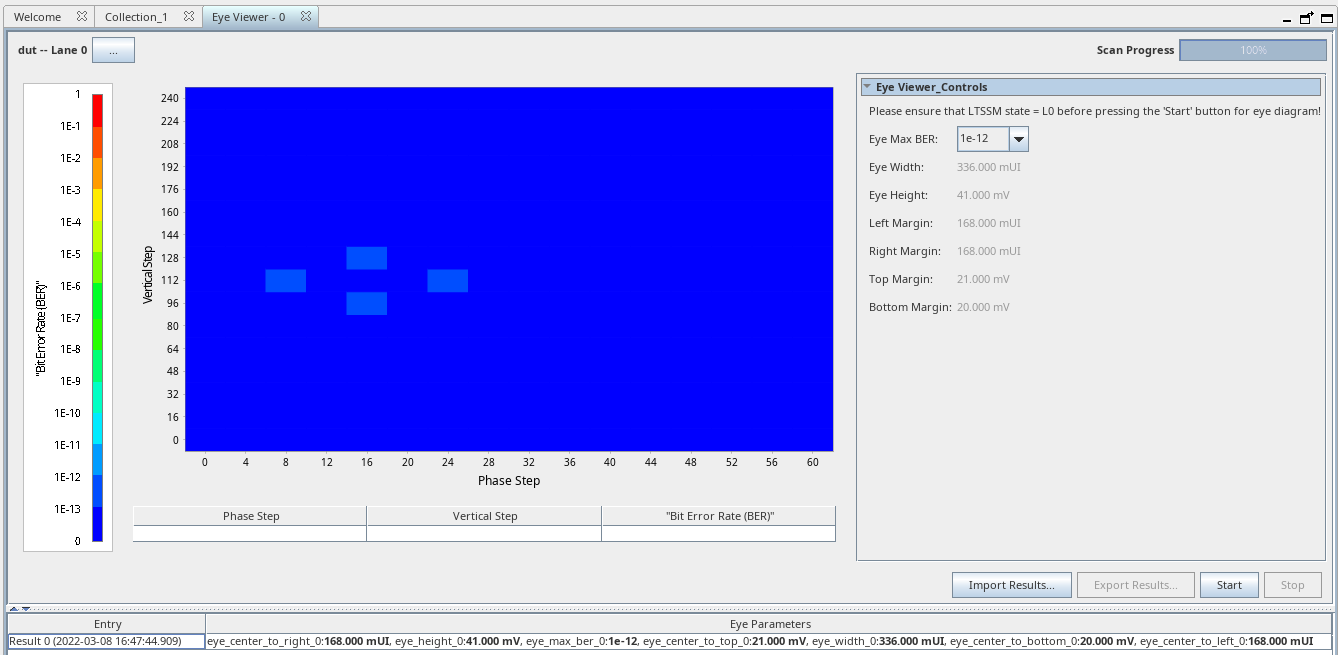 注: Full eye plot is not drawn for BER = 1e-12.注: For P-Tile debug toolkit eye margin mask, refer to the P-Tile Avalon Streaming Intel FPGA IP for PCI Express User Guide