インテルのみ表示可能 — GUID: sok1633469782732
Ixiasoft
1. はじめるまえに
2. はじめに
3. 機能の説明
4. インターフェイスの概要
5. パラメーター (H タイル)
6. パラメーター (P-Tile) (F-Tile) (R-Tile)
7. IP コアを使用したデザイン
8. ソフトウェアのプログラミング・モデル
9. レジスター
10. トラブルシューティング/デバッグ
11. Fタイル Avalon ストリーミング・インテル FPGA IP for PCI Expressユーザーガイドのアーカイブ
12. F タイル Avalon ストリーミング Intel FPGA IP for PCI Express ユーザーガイドの改訂履歴
4.1. ポートリスト
4.2. クロック
4.3. リセット
4.4. マルチ・チャネルDMA
4.5. バーストAvalon Master (BAM) BAR
4.6. バーストAvalon-MM Slave (BAS) インターフェイース
4.7. MSIインターフェイース
4.8. Config Slaveのインターフェイス (RP のみ)
4.9. ハードIP 再構成インターフェイス
4.10. Config TLのインターフェイス
4.11. コンフィグレーションインターセプトインターフェイス(EPのみ)
4.12. データ・ムーバー・インターフェイス
4.13. ハードIPステータス・インターフェイス
8.1.6.1. ifc_api_start
8.1.6.2. ifc_mcdma_port_by_name
8.1.6.3. ifc_qdma_device_get
8.1.6.4. ifc_num_channels_get
8.1.6.5. ifc_qdma_channel_get
8.1.6.6. ifc_qdma_acquire_channels
8.1.6.7. ifc_qdma_release_all_channels
8.1.6.8. ifc_qdma_device_put
8.1.6.9. ifc_qdma_channel_put
8.1.6.10. ifc_qdma_completion_poll
8.1.6.11. ifc_qdma_request_start
8.1.6.12. ifc_qdma_request_prepare
8.1.6.13. ifc_qdma_descq_queue_batch_load
8.1.6.14. ifc_qdma_request_submit
8.1.6.15. ifc_qdma_pio_read32
8.1.6.16. ifc_qdma_pio_write32
8.1.6.17. ifc_qdma_pio_read64
8.1.6.18. ifc_qdma_pio_write64
8.1.6.19. ifc_qdma_pio_read128
8.1.6.20. ifc_qdma_pio_write128
8.1.6.21. ifc_qdma_pio_read256
8.1.6.22. ifc_qdma_pio_write256
8.1.6.23. ifc_request_malloc
8.1.6.24. ifc_request_free
8.1.6.25. ifc_app_stop
8.1.6.26. ifc_qdma_poll_init
8.1.6.27. ifc_qdma_poll_add
8.1.6.28. ifc_qdma_poll_wait
8.1.6.29. ifc_mcdma_port_by_name
インテルのみ表示可能 — GUID: sok1633469782732
Ixiasoft
10.1.3. Launching the Debug Toolkit
Use the design example you compiled by following the Quick Start Guide to familiarize yourself with the Debug Toolkit. Follow the steps in the Generating the Design Example and Compiling the Design Example to generate the SRAM Object File, (.sof) for this design example.
To use the Debug Toolkit, download the .sof to the Intel Development Kit. Then, open the System Console and load the design to the System Console as well. Loading the .sof to the System Console allows the System Console to communicate with the design using NPDME. NPDME is a JTAG-based Avalon-MM master. It drives Avalon-MM slave interfaces in the PCIe design. When using NPDME, the インテル® Quartus® Prime software inserts the debug interconnect fabric to connect with JTAG.
Here are the steps to complete these tasks:
- Use the インテル® Quartus® Prime Programmer to download the .sof to the Intel FPGA Development Kit.
注: To ensure correct operation, use a full installation of the インテル® Quartus® Primeプロ・エディション Software and Devices of the same version of the インテル® Quartus® Prime Programmer and インテル® Quartus® Primeプロ・エディション software that you used to generate the .sof.注: A standalone install of the インテル® Quartus® Primeプロ・エディション Programmer and Tools will not work.
- To load the design into System Console:
- Launch the インテル® Quartus® Primeプロ・エディション software.
- Start System Console by choosing Tools, then System Debugging Tools, then System Console.
- On the System Console File menu, select Load design and browse to the .sof file.
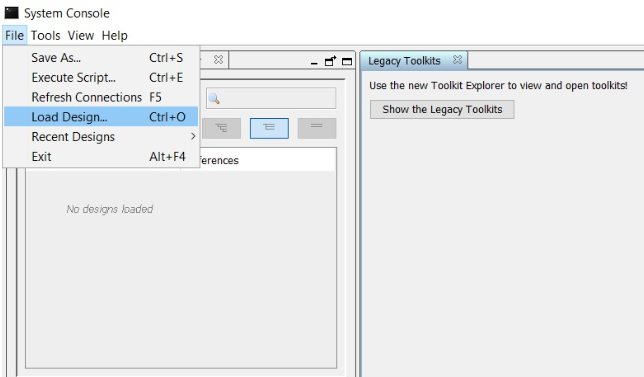
- Select the .sof and click OK. The .sof loads to the System Console.
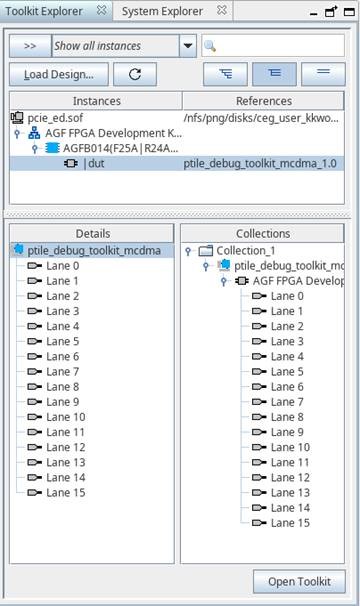
- The System Console Toolkit Explorer window will list all the DUTs in the design that have the Debug Toolkit enabled.
- Select the DUT with the Debug Toolkit you want to view. This will open the Debug Toolkit instance of that DUT in the Details window. An example of P-Tile Debug Toolkit is shown in the following figure.
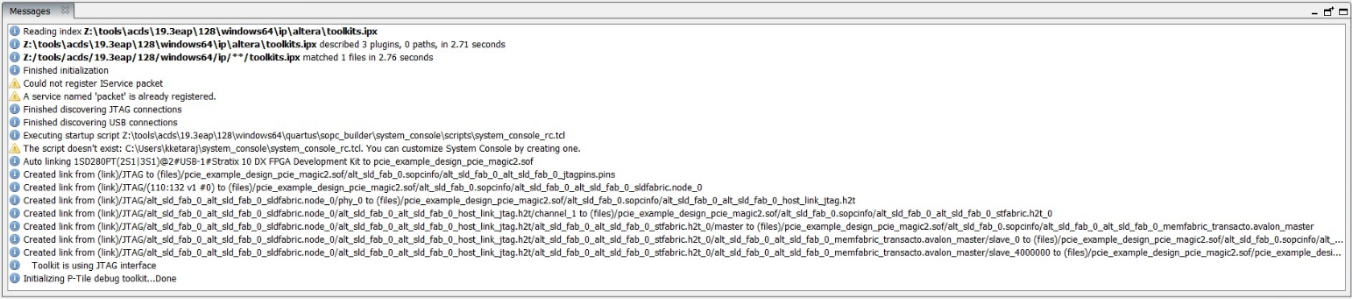
- Click on the ptile_debug_toolkit_mcdma to open that instance of the Toolkit. Once the Debug Toolkit is initialized and loaded, you will see the following message in the Messages window: “Initializing P-Tile debug toolkit – done”.
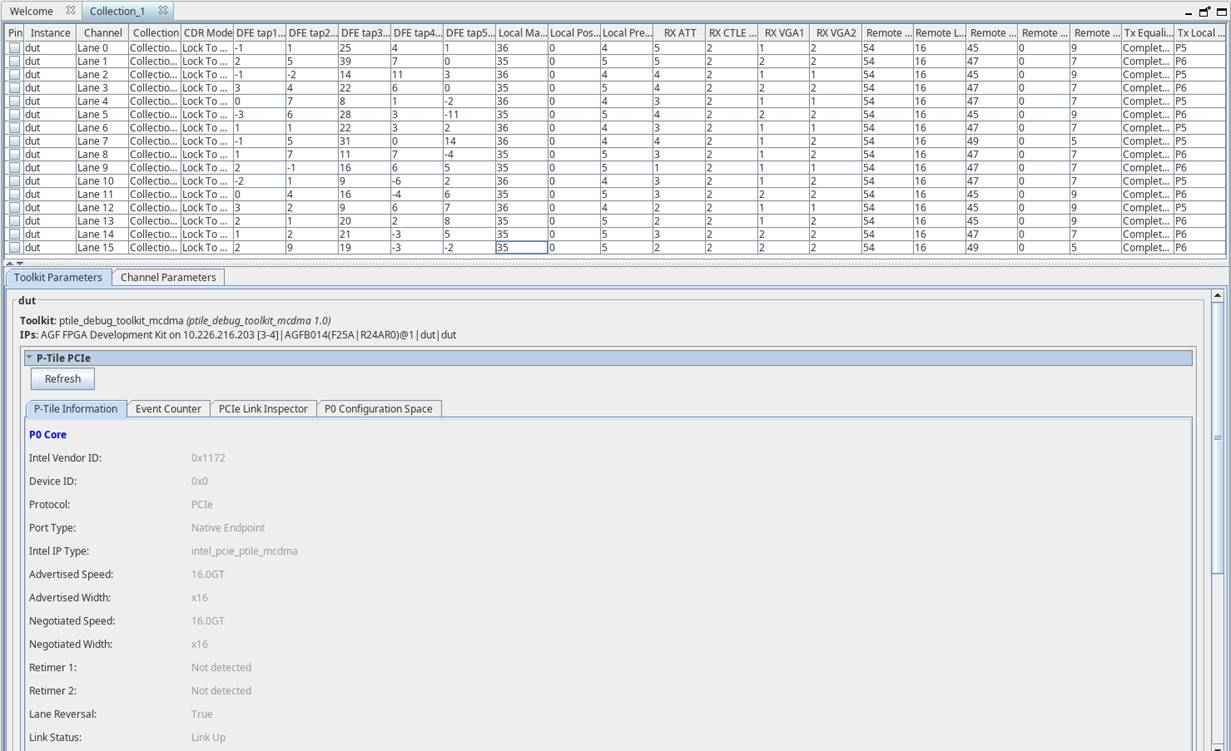
- A new window Main view will open with a view of all the channels in that instance.
- Select the DUT with the Debug Toolkit you want to view. This will open the Debug Toolkit instance of that DUT in the Details window. An example of P-Tile Debug Toolkit is shown in the following figure.